Cpio Review / BLS / PPI
PPI Final Demand Is Flat in July, but the Annual Rate Eases to 4.7%
Producer prices were unchanged in July as falling energy offset gains in services and construction, and the 12-month PPI rate slipped from 5.5% to 4.7%.
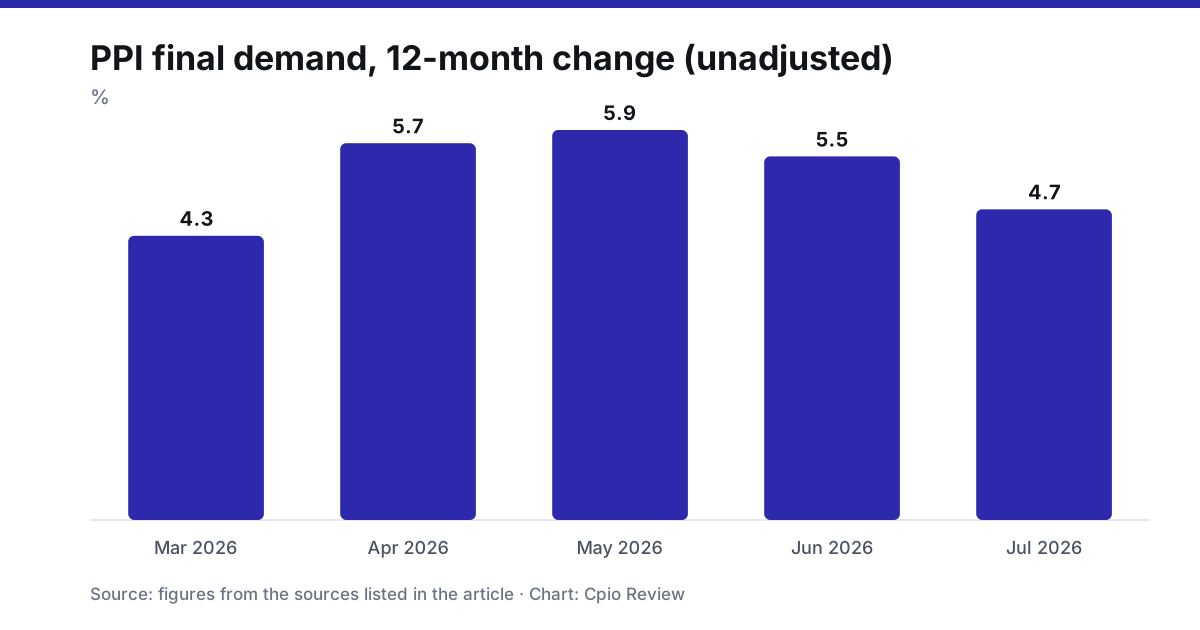
The Producer Price Index for final demand was unchanged in July on a seasonally adjusted basis, the Bureau of Labor Statistics reported on Thursday. The zero comes with a large amount of movement inside it: a 0.7 percent drop in goods prices was offset by a 0.2 percent rise in services and a 2.2 percent jump in construction. On an unadjusted basis, final demand prices were up 4.7 percent for the 12 months ended in July, down from the 5.5 percent annual rate reported for June.
For readers who follow CPI inflation, the report is a look at the cost pressures one step earlier in the chain. The consumer report on Wednesday showed headline prices up 3.4 percent over the year; the producer index sits well above that, and the two measures are converging only slowly.
Goods fall, services hold
Final demand goods declined 0.7 percent in July after a 1.4 percent decline in June. Energy accounted for most of it. Final demand energy fell 3.1 percent, final demand foods fell 0.9 percent, and goods less foods and energy rose 0.1 percent. Gasoline prices fell 5.7 percent and made up more than half of the goods decrease. Fresh and dry vegetables, diesel fuel, jet fuel, residual fuels and thermoplastic resins and materials also declined. Motor vehicles and equipment rose 0.3 percent, and electric power and grains also moved higher.
Final demand services rose 0.2 percent after a 0.5 percent rise in June. The increase came from services less trade, transportation and warehousing, which advanced 0.6 percent. Portfolio management led, rising 6.5 percent. Margins for several retail and wholesale categories also moved higher: health, beauty and optical goods, automobiles and parts, lawn, garden and farm equipment, and food and alcohol. In the other direction, transportation and warehousing services fell 1.8 percent and trade services fell 0.1 percent. Truck transportation of freight dropped 1.8 percent, and securities brokerage, dealing and investment advice, along with machinery and vehicle wholesaling, also decreased.
The portfolio management line deserves a note. Fees in that category generally depend on the value of assets under management, so a large increase in the index often reflects higher asset prices and not a change in the underlying cost of a service. That makes the 6.5 percent gain an input that bears little relation to what manufacturers or retailers pay. It also helps explain why the producer index can appear to show services inflation at the same time that consumer-facing services data are softer.
Final demand construction, a category absent from the consumer index, rose 2.2 percent.
The pattern behind the 4.7 percent annual rate
The final demand index measured 4.7 percent higher than a year earlier. The path of the annual rate over the spring shows how the comparison has moved: 4.3 percent in March, 5.7 percent in April, 5.9 percent in May, 5.5 percent in June and 4.7 percent in July. The peak in May coincides with the peak of the spring energy surge, and the decline since then reflects the retreat in fuel prices as well as the comparison base. July 2025 had a monthly gain of 0.8 percent, which dropped out of the 12-month window as July 2026 came in at zero.
Monthly changes this year were 0.6 percent in January, 0.5 percent in February, 0.8 percent in March, 1.1 percent in April, 0.5 percent in May, minus 0.1 percent in June and zero in July. The BLS revised data for March through June to reflect late reports and corrections, so the figures differ slightly from what the agency published at the time. June, which was first reported as a 0.3 percent decline, now reads as a decline of 0.1 percent.
The index for final demand less foods, energy and trade services, which strips out the three most volatile pieces, rose 0.4 percent in July after 0.1 percent in June, and is also up 4.7 percent over 12 months. The two annual rates coincide this month at 4.7 percent. A broad producer measure that excludes energy and food is still increasing at close to 5 percent a year, and that is the number to hold against the consumer core rate of 2.5 percent.
Intermediate demand: easing, but still hot
The intermediate demand indexes show costs earlier in the chain. Processed goods fell 0.6 percent after a 1.1 percent drop in June, with processed energy goods down 3.1 percent, processed foods and feeds down 0.5 percent and processed materials less foods and energy up 0.1 percent. Diesel fuel dropped 6.7 percent and accounted for more than half of the decline. Lumber rose 5.0 percent. Over the year, processed goods are up 9.9 percent.
Unprocessed goods declined 1.8 percent after a 6.4 percent fall in June. Unprocessed energy materials dropped 7.4 percent, with crude petroleum down 11.9 percent, while nonfood materials less energy rose 1.6 percent and foodstuffs and feedstuffs rose 0.7 percent. Aluminum base scrap rose 5.8 percent. The annual increase for the category is 7.1 percent.
Services for intermediate demand rose 0.5 percent after a 0.7 percent rise in June, and they are up 5.1 percent over 12 months. Portfolio management, up 6.5 percent, accounted for more than a third of the July advance. Trade margins for intermediate demand rose 0.7 percent, and transportation and warehousing fell 0.5 percent.
What to watch
The producer data and the consumer report released a day earlier can be read together. The CPI report showed that core consumer prices rose 0.2 percent in July. The PPI shows that the cost of getting goods to market is still elevated but is no longer accelerating, and that the main source of upward pressure has shifted from energy to services and construction. Whether those pressures reach consumers depends on how much businesses can pass along, a question the next two or three monthly reports will answer.
The report on August data is the next test. Energy, which has driven the swings in both indexes all year, is again the variable to watch. If it stops falling, the goods side of the index will stop offsetting the strength in services, and the flat reading in July will not repeat.
Prepared with AI assistance from the releases listed under Data sources and reviewed under our editorial policy. Not investment advice.