Cpio Review / BLS / Producer Price Index
PPI Rises 0.3% in October, Adding to CPI Inflation Pressure
The Producer Price Index for final demand rose 0.3% in October and 6.5% over 12 months, the largest annual rise since November 2022, the BLS reported Friday.
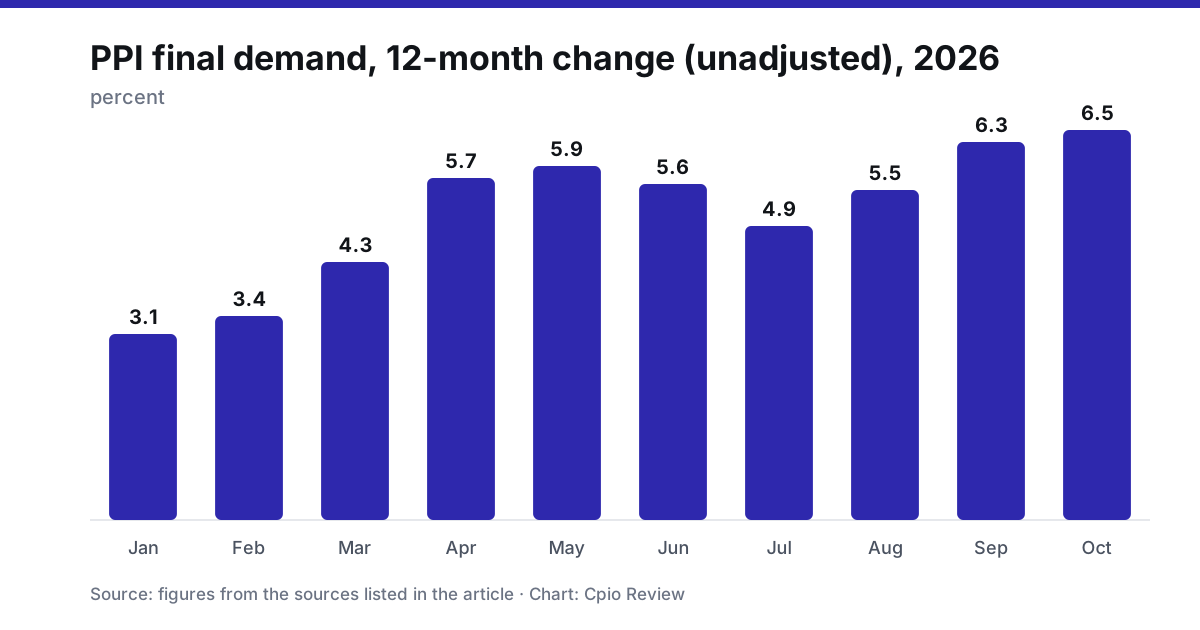
The Producer Price Index for final demand rose 0.3% in October on a seasonally adjusted basis, the Bureau of Labor Statistics reported on November 13, following increases of 1.4% in September and 0.4% in August. On an unadjusted basis the index was up 6.5% over the 12 months ended in October, the largest 12-month rise since 7.4% in November 2022. The report arrives three days after consumer prices showed a 0.4% rise, and it indicates that cost pressure at the producer level is still building even as the monthly pace slows.
The headline and the trend
Producer prices measure what domestic producers receive for goods and services, so they often lead what consumers eventually pay. The monthly table shows how uneven 2026 has been. Final demand moved 0.6% in January, 0.5% in February, 0.8% in March, 1.1% in April, 0.5% in May, then minus 0.1% in June, 0.1% in July, 0.4% in August, 1.4% in September and 0.3% in October. The September figure is revised data, as the bureau flags for June through September.
The 12-month change has climbed from 3.1% in January to 3.4% in February, 4.3% in March, 5.7% in April, 5.9% in May, 5.6% in June, 4.9% in July, 5.5% in August, 6.3% in September and 6.5% in October. A monthly gain as small as 0.3% still lifts the annual figure, because October 2025 was a soft base month at 0.1%.
Core measures tell a similar story. Final demand less foods, energy and trade services rose 0.5% in October, the same as in September, and is up 4.9% for the 12 months. That series sat at 3.5% in January.
The distinction between the headline and the narrower measure is worth keeping in view. The headline is pulled around by food, energy and trade margins, which are volatile. Stripping those out leaves a series that rose 0.5% in each of the last two months, and its annual rate of 4.9% is below the headline’s 6.5%. The gap between the two says that a good part of the annual headline reflects the food and energy components, though the narrower measure is itself far above its 3.5% reading at the start of the year.
Goods lead the month
Final demand goods rose 0.5% after a 2.5% jump in September. More than 60% of the October advance came from goods less foods and energy, which rose 0.5%. Final demand foods increased 1.3%, while energy edged down 0.1%. Over 12 months, final demand goods are up 10.2%, the largest annual rise since 10.5% in October 2022.
Basic organic chemicals rose 3.9%. Fresh and dry vegetables, gas fuels, aeronautical, nautical and navigational instruments, jet fuel and processed young chickens also moved higher. Diesel fuel prices fell 7.9%, and pork and passenger cars declined.
Services and transportation costs
Final demand services rose 0.2%, the fifth consecutive advance. Three-fourths of the rise came from a 2.0% increase in transportation and warehousing services, and over 80% of the services increase is attributable to truck transportation of freight, which rose 3.9%. Services less trade, transportation and warehousing rose 0.2%, while trade margins fell 0.2%. Wholesale margins for machinery and vehicles dropped 4.2%.
Freight costs show up in many other prices, which is why they get attention in the producer index. The pattern here, with trucking up sharply while diesel fuel prices fell 7.9%, shows margins or other pricing factors moving separately from fuel at the producer level.
The pipeline
The report’s intermediate demand tables describe goods and services earlier in the production chain. Processed goods for intermediate demand rose 0.4%, the third consecutive rise, and are up 14.6% over 12 months, the largest since a 17.2% jump in July 2022. Processed materials less foods and energy rose 0.9%, processed foods and feeds 1.0%, and processed energy goods fell 1.6%.
Unprocessed goods fell 3.1%, the biggest decline since 6.6% in June, with unprocessed energy materials down 7.7% and crude petroleum down 10.3%. Even so, unprocessed goods are up 16.9% over 12 months. Services for intermediate demand rose 0.6% after 1.0% in September, with trade margins up 1.6% and transportation and warehousing up 1.2%.
The split is informative. Crude and other raw material costs eased in October, but processed and finished inputs kept rising, which is the usual order in which a commodity move works its way through. Whether it reaches consumers depends on margins and demand.
Connection to CPI inflation
The consumer report on November 10 showed all-items CPI up 0.4% in October after 0.6% in September, with core at 0.3%, food at 0.5% and energy at 0.7%. The producer data add two observations. First, producer food prices rose 1.3% while consumer food at home rose 0.4%, so some of the producer food increase may not yet have passed through. Second, final demand goods less foods and energy, up 0.5%, is moving faster than consumer core goods, which rose 0.2% in the CPI.
Those comparisons are indicative, not proof of pass-through. The two indexes cover different baskets and weights, and producer prices leave out some things consumers pay for, such as sales taxes and imported goods. Producer indexes also revise more often; the bureau notes that data for June through September were revised.
Still, the persistence of the annual rate above 6% at the producer level means the conversation about CPI inflation is not only about energy. Goods less food and energy and transportation services are carrying a share of the increase, and both categories bear on consumers in the months ahead.
What to watch
Three items will say whether this pressure reaches households: whether freight costs stay elevated after the 3.9% rise in truck transportation, whether the 1.3% food increase appears in grocery prices, and whether the decline in unprocessed energy materials flows to processed energy goods. The next releases will update each, and the annual PPI comparison faces a tougher base as 2025 months drop out.
Prepared with AI assistance from the releases listed under Data sources and reviewed under our editorial policy. Not investment advice.