Cpio Review / BLS / Inflation
PPI Jumps 0.3% as CPI Inflation Stays Firm in October
October producer prices rose 0.3% and are up 6.5% from a year earlier. We look at how the PPI report fits with a 0.4% CPI gain and what to watch next.
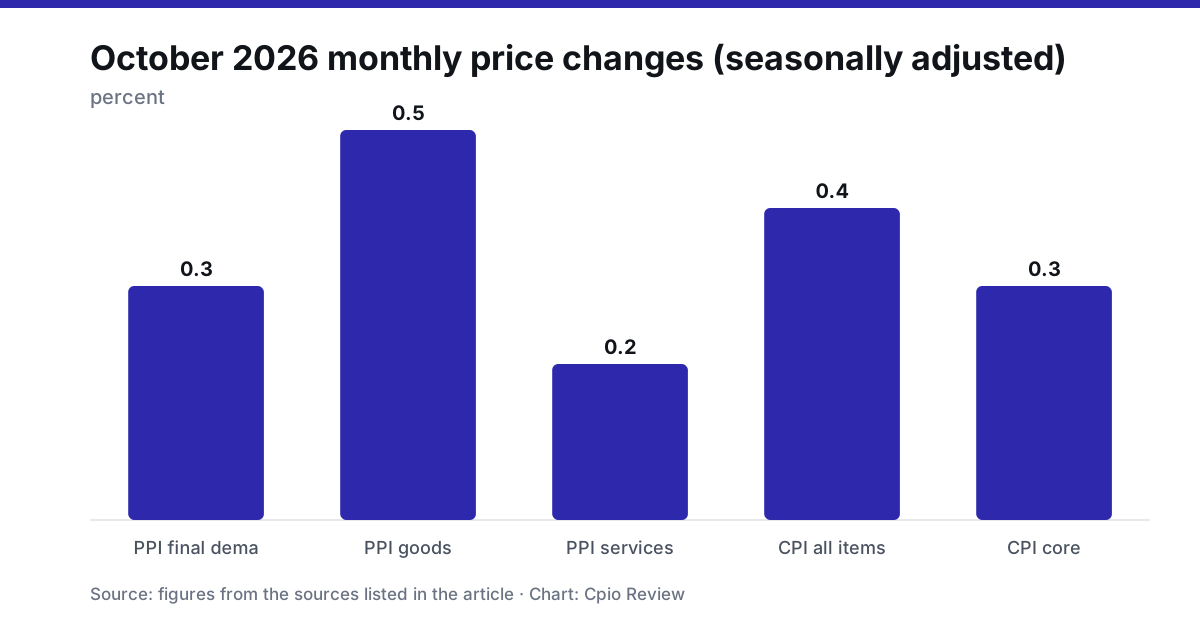
Two inflation reports landed within four days of each other this month, and read together they describe an economy where price pressure has not faded quietly. The Consumer Price Index rose 0.4 percent in October on a seasonally adjusted basis. Three days later, the Bureau of Labor Statistics said the Producer Price Index for final demand rose 0.3 percent. The producer-side report also carried a striking annual figure: final demand prices advanced 6.5 percent over the 12 months ended in October.
Neither number is a shock by itself. Together, though, they raise a question that matters for households, businesses and policymakers: is the upward pressure at the consumer level being fed from further up the supply chain, or are the two gauges simply moving on their own timetables?
Key takeaways
- The PPI for final demand rose 0.3 percent in October, and is up 6.5 percent from a year earlier.
- Final demand goods prices rose 0.5 percent in the month, while final demand services rose 0.2 percent.
- The CPI for all urban consumers rose 0.4 percent in October, seasonally adjusted. The index excluding food and energy rose 0.3 percent, and shelter was a notable contributor.
- Goods prices at the wholesale level are running faster than services prices, a mix worth watching in coming reports.
What the producer price report shows
The Producer Price Index measures the prices that domestic producers receive for their output. The “final demand” aggregate covers goods, services and construction sold for personal consumption, capital investment, government use and export. It is the broadest of the BLS producer measures, and it is often read as a signal of the costs businesses face, and may try to pass on, before those costs reach store shelves or service contracts.
In October the headline rose 0.3 percent. The split underneath was uneven. Final demand goods climbed 0.5 percent, while final demand services moved up 0.2 percent. Goods are the smaller portion of the index, and services the larger. That helps explain why a strong goods reading produced a more modest overall increase. The services reading, though, was positive and not trivial.
The year-over-year figure of 6.5 percent is the headline that will draw the most attention. A single month’s change tells you about momentum. A 12-month change tells you about the accumulated climb in prices producers receive. A reading of that size indicates that the cost of getting products and services to market has risen substantially over the past year. We would be cautious about drawing sweeping conclusions from one annual number, but it is clearly not a sign of a producer-price environment that has cooled.
How CPI inflation compares
The consumer report released on November 10 offers a useful counterpart. The all-items CPI rose 0.4 percent in October, a faster monthly pace than the 0.3 percent producer gain. The core measure, which strips out food and energy, rose 0.3 percent. The BLS headline for the release pointed to shelter as an area of increase.
That detail is important in interpreting CPI inflation. Shelter is the single largest category in the consumer basket. When it rises, it tends to lift the overall index in a way that is persistent rather than flighty. Housing costs move through rents and owners’ equivalent rent, which are slower-moving than gasoline or produce. A shelter-driven increase therefore tends to be read differently from an energy-driven spike. It is less likely to reverse next month.
The gap between the 0.4 percent headline and 0.3 percent core also tells us that food and energy added something to October’s headline. The BLS summary we have does not break out those components, so it would be speculative to say by how much. But the direction is clear enough: core inflation was firm, and the volatile categories did not offset it.
Why the two reports do not map neatly onto each other
It is tempting to treat the PPI as a preview of the CPI. The relationship is looser than that. The two indexes cover different things. The CPI tracks what consumers pay, including taxes and retail markups, for a basket of goods and services that households buy. The PPI tracks what sellers receive, and its final demand measure includes items such as capital equipment and exports that consumers never buy directly. Services in the PPI also include margins for trade services, which can swing sharply from month to month.
So a 0.5 percent rise in producer goods prices does not translate one-for-one into 0.5 percent higher consumer goods prices. Retailers can absorb some of the increase in their margins, or delay passing it along. Conversely, if producers’ costs ease, retailers may not cut prices quickly. What the PPI does give analysts is a reading of the direction of cost pressure. In October, that direction was upward in both goods and services.
The producer data also matters for another inflation gauge. Components of the PPI are used by government statisticians in constructing the Personal Consumption Expenditures price index, the measure the Federal Reserve uses for its inflation target. Economists often revisit their PCE inflation estimates after the PPI is published for that reason. We do not yet have the October PCE figure in hand, so any forecast would be conjecture, but the producer report is one of the inputs that will shape it.
What to watch next
Several questions will determine whether October marks a blip or a trend. The first is whether goods inflation at the producer level continues to outpace services. A sustained goods-led increase would suggest cost pressures are concentrated in physical supply chains. If services catch up, the pressure is likely broader and stickier, because services costs are heavily tied to wages.
The second is shelter. If the shelter component continues to rise in upcoming CPI releases, core inflation will have a hard time moving decisively lower, regardless of what happens with goods. The third is the annual comparison. A 6.5 percent year-over-year PPI figure will look different in coming months as base effects from last year’s readings roll off. Whether the annual rate rises or falls will depend as much on what happened a year ago as on what happens this winter.
For consumers and small businesses, the practical implication is straightforward even without forecasting. Input costs have risen over the past year, and the latest monthly data show no clear sign of relief. For policymakers, a 0.4 percent consumer price gain, a 0.3 percent core gain and a 0.3 percent producer gain make for a difficult argument that disinflation is on autopilot.
The next releases will say more. One month of data rarely settles a debate, but October’s numbers add weight to the case that price pressure is still working its way through the system, from producers to consumers and across goods and services alike.
Prepared with AI assistance from the releases listed under Data sources and reviewed under our editorial policy. Not investment advice.