Cpio Review / BLS / Nonfarm Payrolls
Nonfarm Payrolls Drop 23,000 in July as Jobless Rate Stays at 4.1%
July nonfarm payrolls fell by 23,000, with local government education and retail shedding jobs, while downward revisions left May and June 103,000 lower.
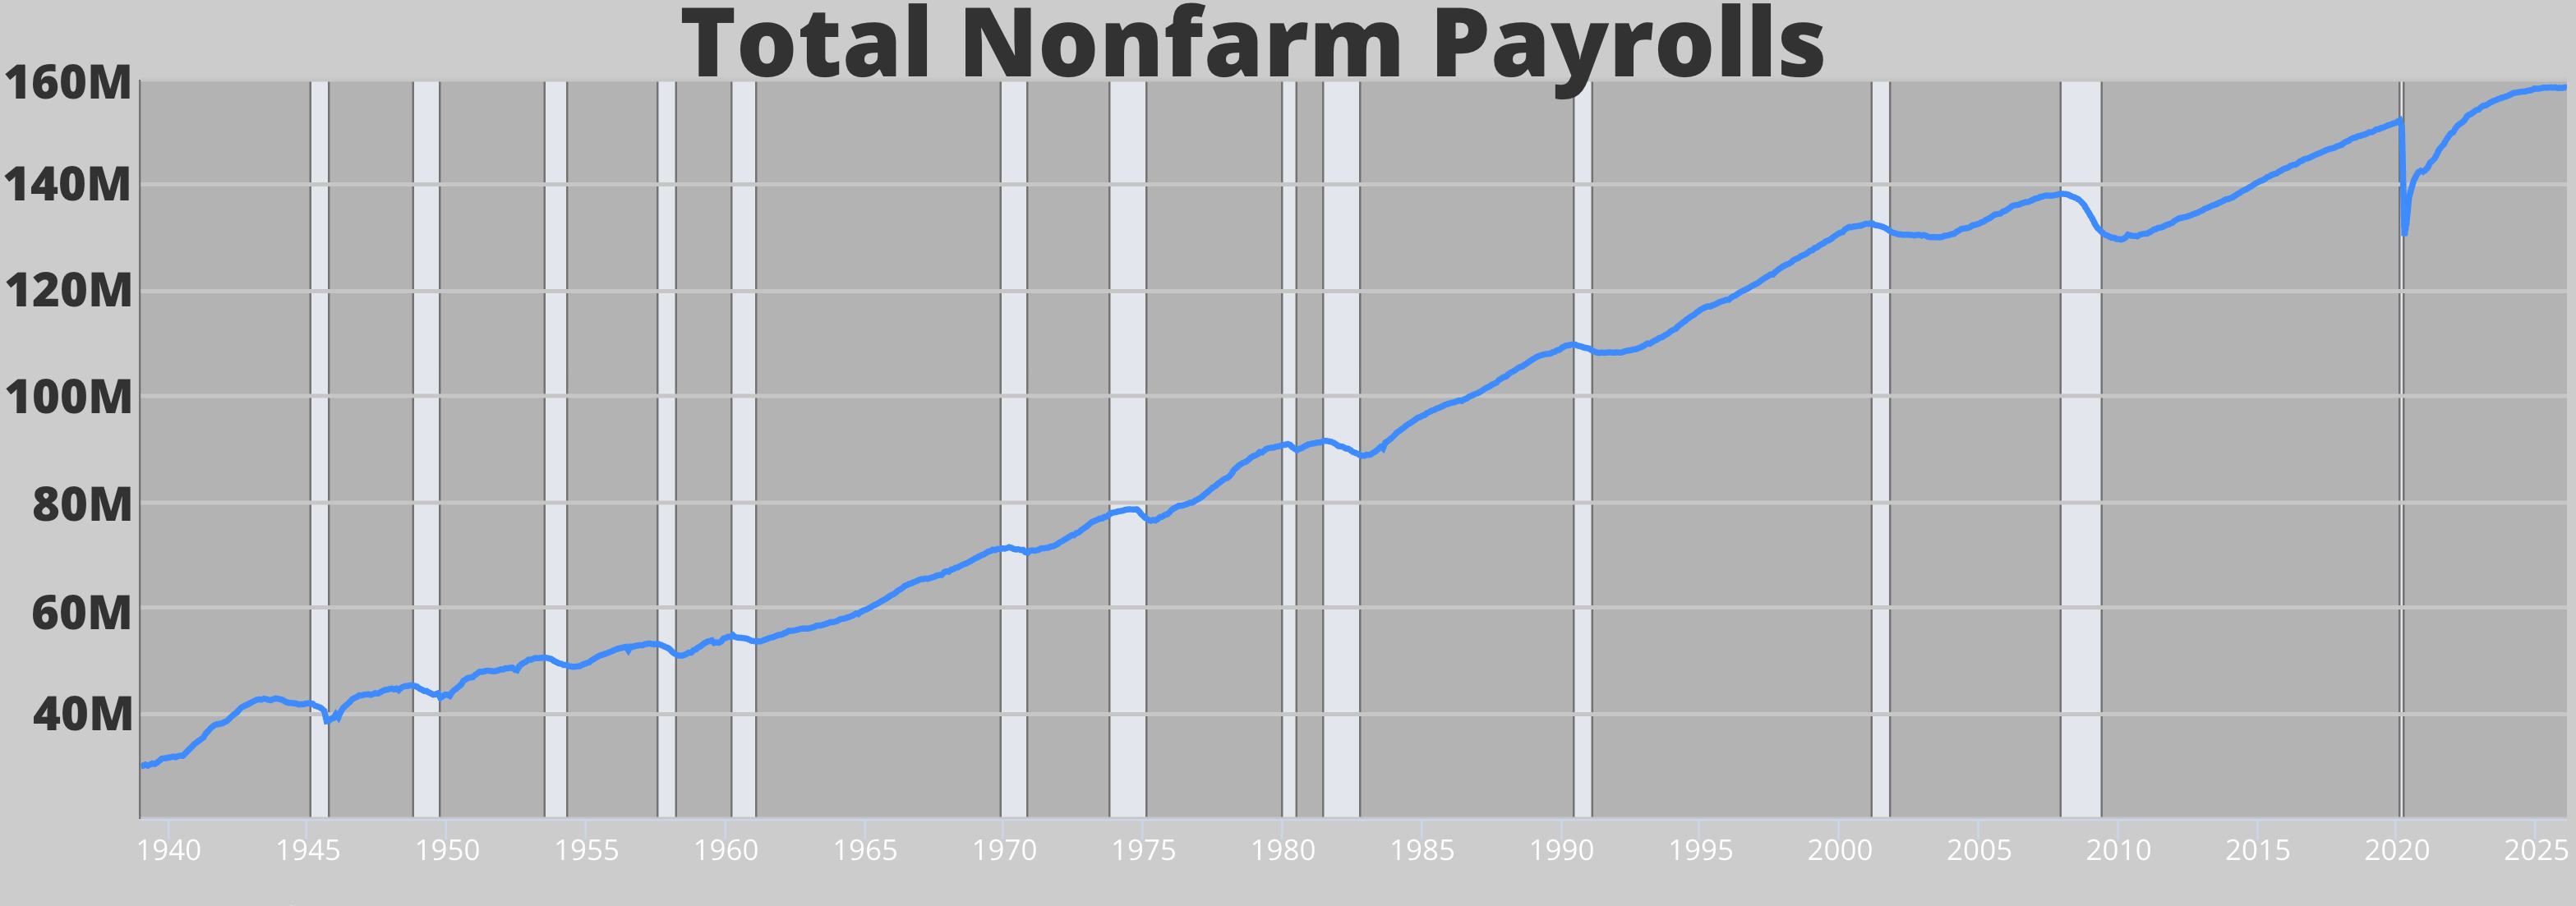
The July employment report offered two numbers that point in different directions. Nonfarm payrolls fell by 23,000, the Bureau of Labor Statistics said on Friday, and the unemployment rate stayed at 4.1 percent. A shrinking payroll count would normally push the jobless rate up. That it did not tells most of the story of this labor market: hiring is weak, but so is the supply of people looking for work.
The BLS described both changes as small in statistical terms. Beyond the headline, the report contains downward revisions to the prior two months, a decline in labor force participation since January, and a mix of job losses that points to specific sectors and not to a broad collapse.
Where nonfarm payrolls fell in July
The establishment survey showed employment declining in local government education and in retail trade, while health care continued to add jobs. Local government education fell by 50,000, after showing little net change over the previous 12 months. Retail trade lost 19,000 jobs, with warehouse clubs, supercenters and other general merchandise retailers down 21,000 and gasoline stations and fuel dealers down 5,000. Sporting goods, hobby, musical instrument, book and miscellaneous retailers added 10,000.
Financial activities lost 14,000 jobs, including 9,000 in credit intermediation and related activities and 7,000 in insurance carriers and related activities. The sector is down 121,000 since a recent peak in May 2025, a steady erosion in monthly steps.
Health care added 22,000 jobs, slower than the 36,000 monthly average of the prior 12 months. Ambulatory health care services accounted for 18,000 of the gain. Employment in other major industries, including construction, manufacturing, wholesale trade, transportation and warehousing, information, professional and business services, leisure and hospitality, and mining, showed little change.
The establishment tables also show that private payrolls rose by 30,000 in July. Given the total decline of 23,000, government employment must have subtracted about 53,000, which fits the 50,000 drop in local government education.
Revisions lower the recent trend
The revisions matter as much as the July figure. The change in total nonfarm payroll employment for May was revised down by 66,000, from +129,000 to +63,000, and the change for June was revised down by 37,000, from +57,000 to +20,000. Together the two months are 103,000 lower than previously reported.
After the changes, the sequence of monthly gains reads as 63,000 in May, 20,000 in June and a decline of 23,000 in July, a three-month slide. Over the prior 12 months, payrolls grew by an average of 34,000 a month. Against that average, the downward drift of the last three months is hard to miss.
The BLS also pointed to a separate adjustment on the calendar. On August 28 it will publish a preliminary estimate of the annual benchmark revision to the establishment survey, which aligns the payroll estimates with state unemployment insurance tax records for March. Official estimates will not change on that day, and the final benchmark comes with the January 2027 report in February 2027. The preliminary figure could shift the interpretation of the past year, since the employment level it is benchmarked against is the foundation for every monthly change.
The unemployment rate and participation
The household survey, which is a separate sample, put the unemployment rate at 4.1 percent and the number of unemployed at 6.9 million. Both changed little over the month and over the year. Among major worker groups, the rate for teenagers fell to 12.1 percent and for Hispanic workers to 4.6 percent. Adult men were at 3.9 percent, adult women at 3.7 percent, White workers at 3.6 percent, Black workers at 6.3 percent and Asian workers at 4.0 percent.
The interpretation of a stable unemployment rate depends on what is happening to the labor force. The participation rate was 61.4 percent in July and has fallen by 0.7 percentage point since January. The employment-population ratio, at 58.9 percent, is down 0.5 point over the same stretch. When fewer people are working or looking, the unemployment rate can hold steady with weak hiring, because people who leave the labor force are not counted as unemployed. The household survey counted 5.9 million people not in the labor force who want a job, little changed from June, and the number of discouraged workers was essentially unchanged at 476,000.
There are also signs of churn beneath the surface. The number of people on temporary layoff rose by 153,000 to 921,000, while permanent job losers were little changed at 1.7 million. The number jobless for less than five weeks edged down to 2.0 million and is 344,000 lower than a year earlier. Long-term unemployment, those jobless for 27 weeks or more, edged down to 1.8 million and made up 25.5 percent of the unemployed. Part-time work for economic reasons stood at 4.8 million.
Wages and hours
Average hourly earnings for all private nonfarm employees rose 2 cents to $37.62 and are up 3.2 percent over the past year. For production and nonsupervisory employees, the average was $32.40, a gain of 4 cents. With the consumer price index rising 3.5 percent in the year to June, as the BLS reported last month, a 3.2 percent wage increase implies that real hourly earnings are slightly behind inflation. The average private workweek held at 34.3 hours, with manufacturing at 40.4 hours and overtime at 3.1 hours.
What to watch
The report arrives a little over a week after the Bureau of Economic Analysis reported a personal saving rate of 2.7 percent for June, and the connection is direct: households with thin cushions rely on payroll income. The next Employment Situation, for August, is scheduled for September 4. The questions are whether the revisions to earlier months continue to run downward, whether the education and retail losses were one-month events, and whether participation stabilizes. Another drop in the participation rate would turn a statistical footnote into the main story, since it would show the unemployment rate is being held down by people leaving the labor force instead of by hiring.
Prepared with AI assistance from the releases listed under Data sources and reviewed under our editorial policy. Not investment advice.