Cpio Review / BLS / CPI inflation
CPI inflation hits 3.7% as gasoline lifts September prices
September CPI inflation rose 0.6% on the month and 3.7% on the year, with gasoline leading. Core prices ran far cooler at 0.3% and 2.6%. What the split means.
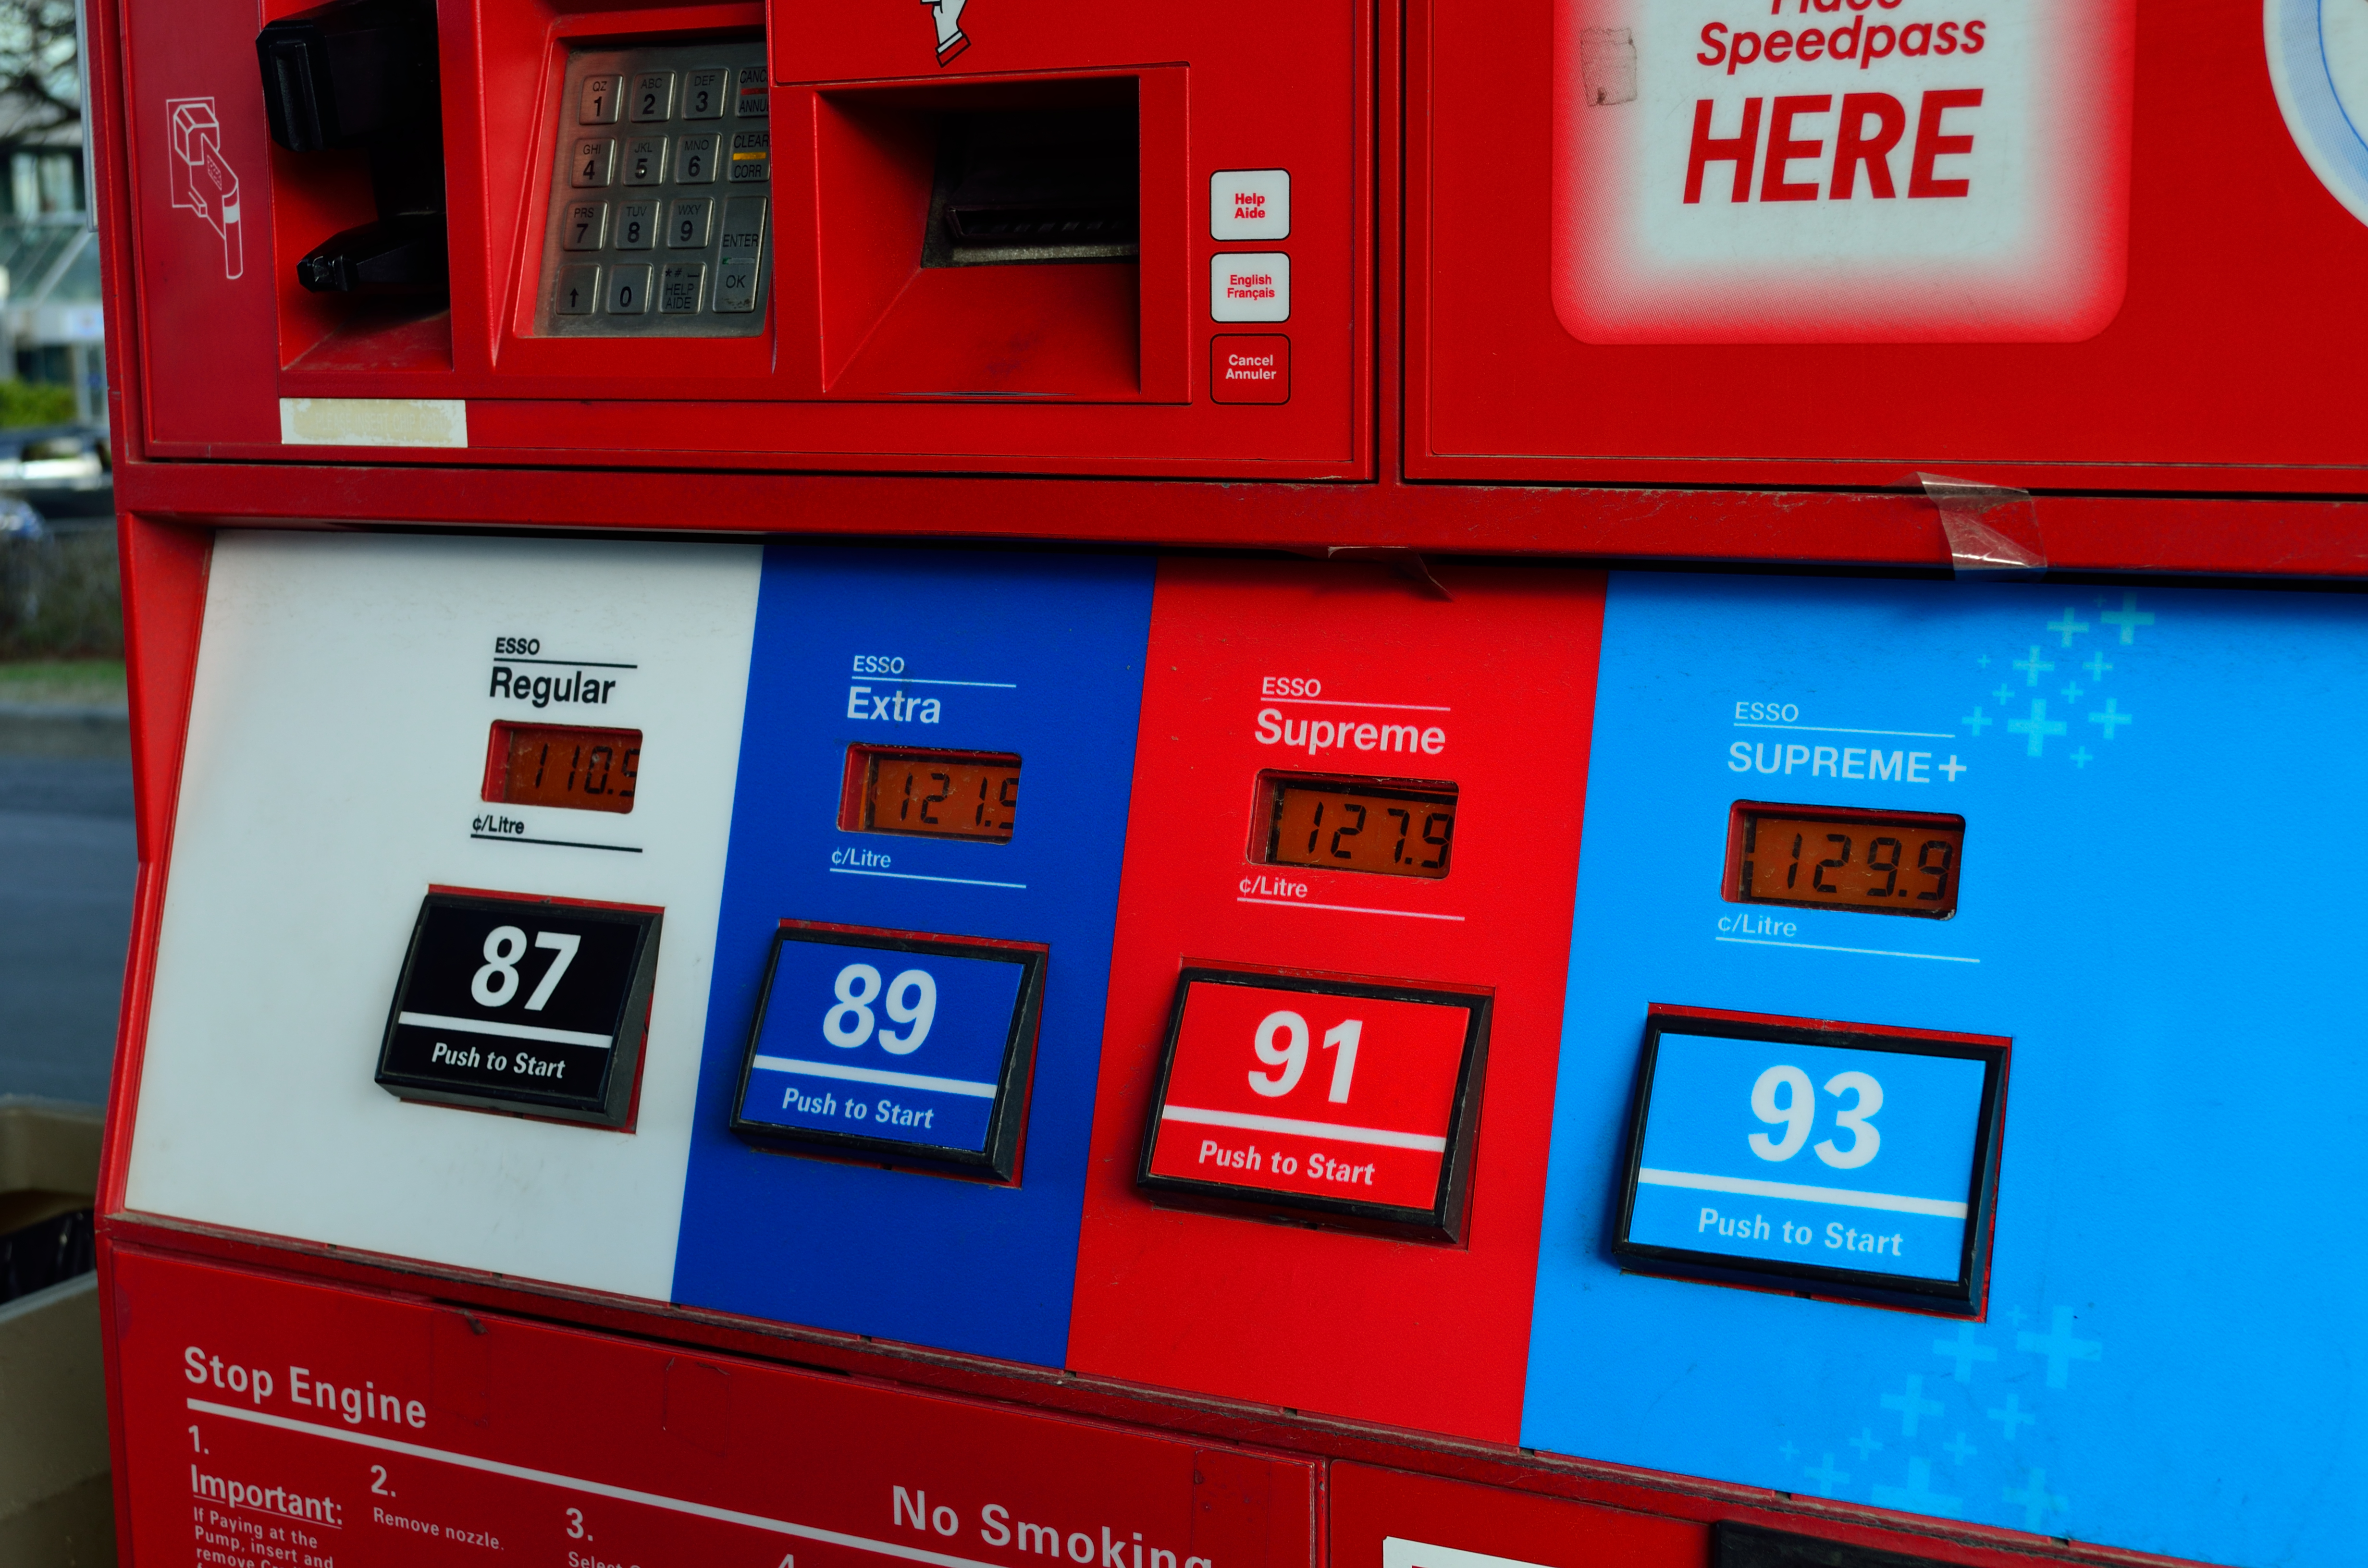
U.S. consumer prices climbed faster than many households would like in September, and the details of the report matter as much as the headline. The Bureau of Labor Statistics said Wednesday that the Consumer Price Index for All Urban Consumers rose 0.6 percent on a seasonally adjusted basis for the month, leaving CPI inflation at 3.7 percent over the past twelve months before seasonal adjustment. Stripping out food and energy, the picture looked noticeably calmer: the core index rose 0.3 percent in September and 2.6 percent from a year earlier.
That gap, about 1.1 percentage points between the annual headline rate and the annual core rate, is the central story of the release. It tells us where the pressure is coming from, and it frames the questions that policymakers, businesses and families will be asking in the weeks ahead.
Key takeaways
- The all-items CPI rose 0.6 percent in September (seasonally adjusted) and 3.7 percent over the year (not seasonally adjusted), according to the BLS.
- Core CPI, which excludes food and energy, rose 0.3 percent on the month and 2.6 percent on the year.
- The BLS headline for the release points to gasoline as a notable upward force.
- The distance between headline and core suggests the strain is concentrated in volatile categories rather than broadly spread across the economy.
What the September numbers show
A 0.6 percent monthly gain is a large move for a price index that, in calmer periods, tends to edge up by a few tenths. Taken on its own, a figure of that size would be a reason for concern. But the composition is what gives it meaning. The BLS titled its release by noting that gasoline rose, a signal that a single energy component was a prominent driver of the monthly increase.
Core prices, by contrast, advanced 0.3 percent. That is still a firm reading if sustained month after month, but it is half the pace of the all-items index. In practical terms, roughly half of the headline monthly increase was not explained by the core basket, which means food and energy, and gasoline in particular according to the BLS, carried a disproportionate share of the load.
On an annual basis, the 3.7 percent headline and 2.6 percent core readings tell a similar story at a slower tempo. Over twelve months, the cost of living measured by the broad index has risen noticeably faster than the narrower gauge that economists use to read underlying trends. Investing.com, summarizing the release, led with the 3.7 percent annual figure, which is the number most likely to reach household conversations and political debate.
One technical note is worth keeping in mind. The BLS reports the monthly change on a seasonally adjusted basis, which smooths out predictable calendar patterns, while the annual change is reported on a not-seasonally-adjusted basis. Readers comparing the two figures are therefore looking at slightly different constructions, and the monthly number is the better guide to momentum while the annual number describes the accumulated change.
Why the headline-core split matters
Economists separate food and energy from the rest of the index not because those costs are unimportant to consumers, but because they swing sharply for reasons that often have little to do with domestic demand. Gasoline responds to crude oil markets, refining conditions, seasonal driving patterns and geopolitical events. When energy leads the index higher, the inflation is real for anyone filling a tank, yet it may not signal that price-setting power is broadening across services and goods.
That is why a 2.6 percent core reading alongside a 3.7 percent headline reading invites a measured interpretation. The core rate suggests that underlying inflation is running well below the headline figure. At the same time, the 0.3 percent monthly core gain is a reminder that the trend is not flat, and a persistent pattern at that pace would, over a year, compound to something higher than the current annual core rate. One month does not establish a trend in either direction.
There is also a second-round question. Higher fuel costs can seep into other prices over time, since transportation is an input for many goods and services, and they can shape what consumers expect for future inflation. Whether that happens is not something a single report can answer. The core category will be the first place to look for evidence, because a pass-through from energy would tend to show up there in subsequent months.
Who feels it, and what to watch next
Lower- and middle-income households typically feel gasoline increases most directly, because fuel is a necessary and often unavoidable expense that takes up a larger share of their budgets. A headline rate of 3.7 percent will therefore feel more relevant to many families than the core rate of 2.6 percent, even if analysts prefer the latter for gauging the underlying trend. Workers whose wages or benefits are tied to the headline index are also directly affected by the gap.
For businesses, a fuel-led price increase raises delivery and operating costs, and decisions about whether to pass those costs along will depend on how resilient customer demand proves to be. For the Federal Reserve and other observers, the key issue is whether the energy-driven jump is a temporary shock that fades, or whether it begins to alter the broader inflation pattern. The central bank’s preferred measures and its statements will be read closely in that light, though today’s release alone does not settle that question.
Several things bear watching. First, whether gasoline prices hold, ease or climb further in October, since that will largely decide whether the headline rate stays elevated. Second, whether core readings stay near the 0.3 percent monthly pace or accelerate, which would suggest energy costs are spreading into the rest of the basket. Third, how the annual comparison evolves as September’s large monthly increase either remains in or rolls out of the twelve-month window in later reports.
A reading that rewards patience
The temptation after a report like this is to pick a single number and build a narrative around it. The more defensible reading is layered. Consumer prices rose sharply in September. The increase was concentrated in a volatile category, with gasoline highlighted by the BLS. Underlying inflation, as measured by the core index, is higher than a calm month would produce but remains well below the headline annual rate.
For informed readers, the practical lesson is to hold both figures in view at once. The 3.7 percent annual rate describes what households have actually experienced in their budgets over the past year. The 2.6 percent core rate offers a clearer sense of the persistent, domestically driven pressure. The next few reports will show whether those two measures converge because energy costs settle back, or because core inflation moves up to meet them.
Prepared with AI assistance from the releases listed under Data sources and reviewed under our editorial policy. Not investment advice.